Vietnam College Entrance Exam 2020
24 Dec 2020Introduction
In Vietnam, high school graduates need to take a standardized college entrance exam to get considered for higher education. They need to take five subject tests: Math, Literature, English, Social Sciences and Natural Sciences. Parents and students prepare three years of high school for this one exam, that in many people’s opinions determine your future. Before 2015, students has to take two exams: one deciding whether they graduate high school, and the other is the college entrance exam. These two exams now became one, therefore it is extremely stressful for students in their last year of high school.
I was interested to see the results of the students. In this project, I scraped 74,000 exam takers scores in 2020 from the official Government website of Ho Chi Minh city, transformed it to find insights about this exam. I then visualized in with Tableau to give the audience insights on this exam.
Ask
There are some few questions I was curious beforehand:
- What is the age of the test takers?
- How well did the students do, score-wise?
- What is the score distribution among age and subjects?
- Are there any student that took more than five subjects?
- Is Nguyen the most common last name? :D
Collect and Process
First we will go to http://diemthi.hcm.edu.vn/Home. This site updated score every year, thus the version in the screenshot below might not be the same. There is a search box available. Students will put their candidate ID in here, press search (Xem điểm), and the site will show their results.


There are total 74,719 participants in Ho Chi Minh City. From my understanding, the ID takes the form of eights digits. They start from 02000001 and end with 02074719. In this project, I created a simple Python file to crawl the data from the website, by opening the website, input in the IDs, and save the entire html code into a .txt file for all 74,719 participants. Here is how the code looks like.
import subprocess
result = subprocess.check_output('curl -F "sobaodanh=02000145" diemthi.hcm.edu.vn/Home/Show')
print(result)

f = open("sobaodanh.txt","r+")
f.truncate(0)
f.close()

for i in range(2000001,2074719):
    with open("sobaodanh.txt","a") as f:
        subprocess.run('curl -F "sobaodanh=0'+str(i)+'" diemthi.hcm.edu.vn/Home/Show,stdout=f)
        f.close()
        print(i-2000000)
This code snippet will run through all 74,719 exam takers’ ID, and grab the html site into the text file, as explained above. It took me around 3 hours to scrape this data, and I believe there is a more time-efficient way to do this. The text file is approximately 170 MB in size.
After scrapping process, we need to clean the file so that it allows us to see the students’ name, DOB, and their scores in table format. I use another Python file to do it, however it was quite manual to look for what to delete and what to keep. You can download this cleaning python file here.
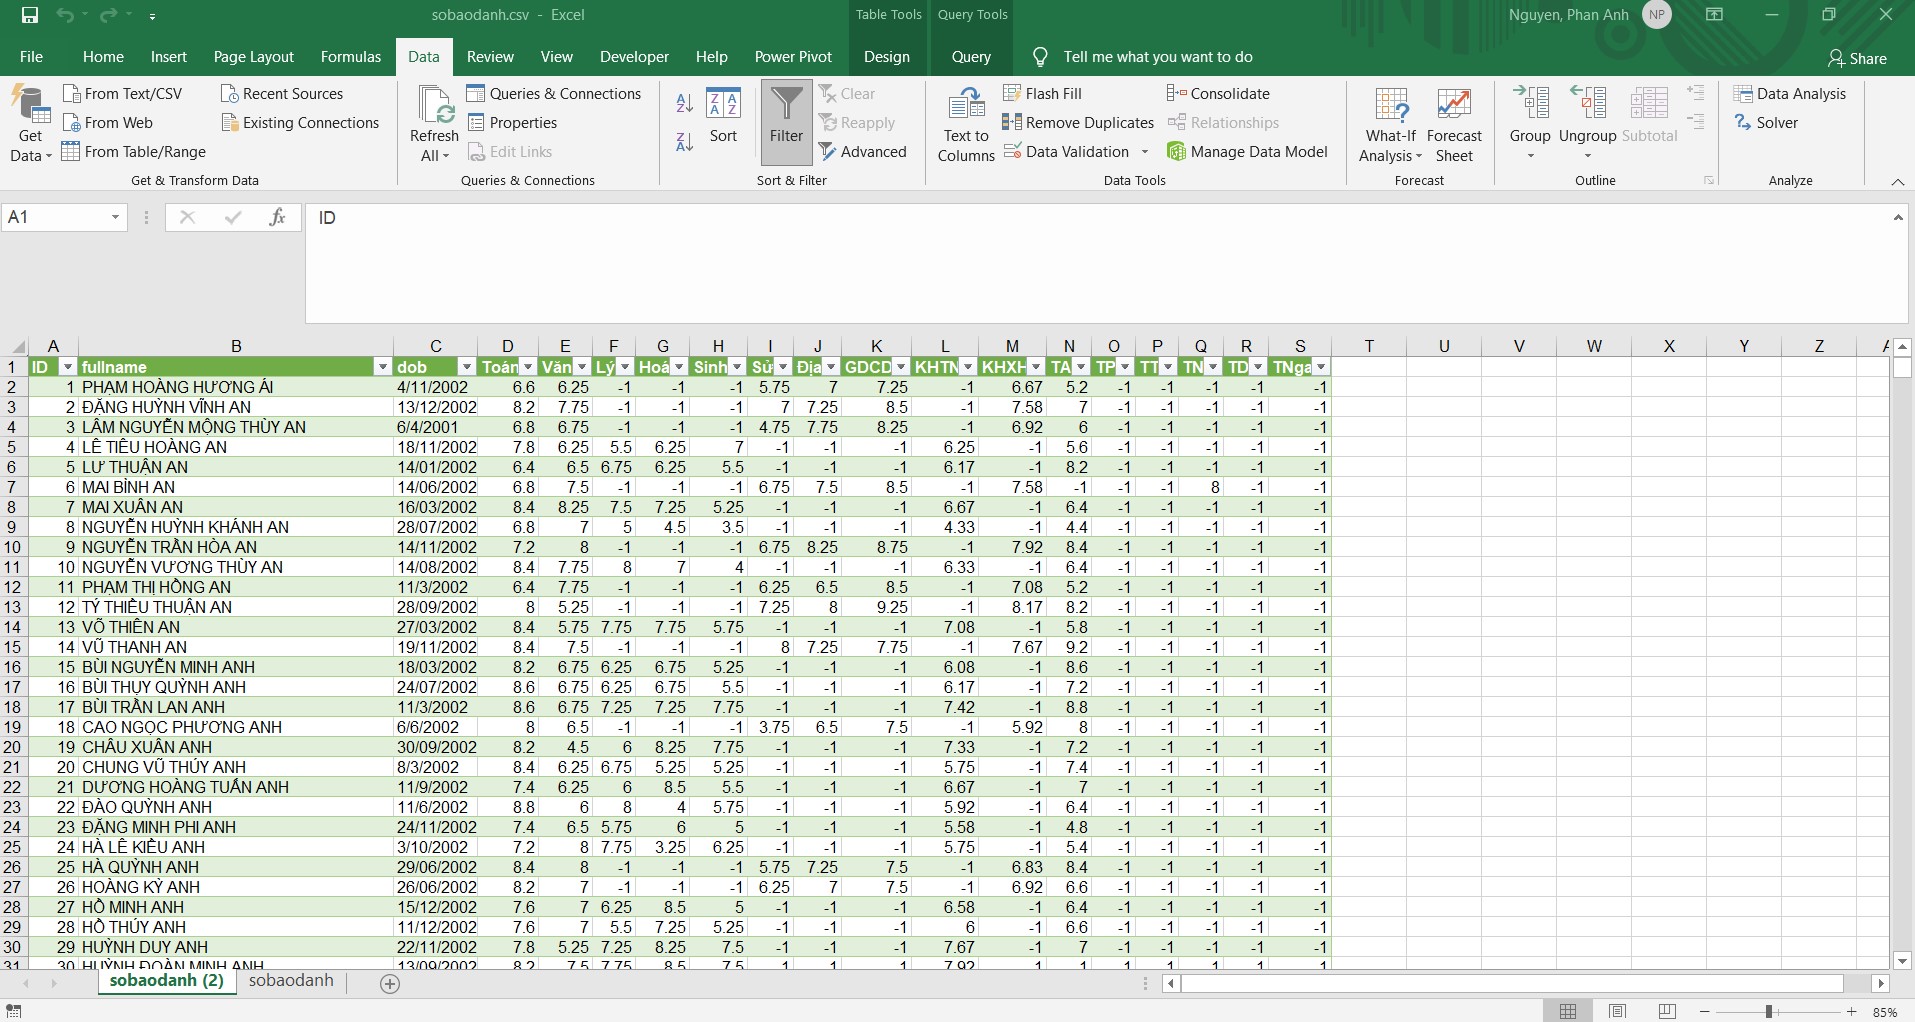
Here is how the clean csv looks like

The headers are ID, Name, DOB and the subjects . Every row is a candidate, and their respective scores for each subjects. -1 means the candidate did not take that particular subject.
After having a clean .csv file, I push it into Tableau Public, pivoted it, and created this visualization.
Analysis
The total participants in my viz is 74,451, instead of 74,719. Approximately 300 records were missing, which I am not sure the cause of. We will dive into this data viz to extract some exploratory insights.
Around 66,000 of test takers are 18-20 years old. These are the age of high-schoolers getting into college. There are people from all ages, surprisingly there is 6 test takers who are older than 50. Median score is 6.8, therefore it is considered quite tough.
Math, Literature and English are the main mandatory subjects that everyone needs to take. With higher ages, the average score of these three subjects get lower. It might be because older people have less access to common education.
Most test-takers take 6 six subjects. Besides the three mandatory subjects, they have to choose one between Natural Sciences (Physics, Chemistry, Biology) and Social Sciences (History, Geography, Ethics). There is only one test-taker who took all nine subjects. I have checked her data, and found out that even though she registered for both optional combo tests, she only took one, so her total subjects taken are six.
Even though Math, Lit and English are mandatory, the number of test-takers are not the same. Math has more participants than Lit does, and Lit has more than English does. One possible reason for this is because of the schedule of the tests. Math is first, Lit is second and English is last. It might be the case that people who didn’t do well on a subject, chose not to take the other ones which schedule after. Or simply they just forgot about it. I can do deeper analysis later to check this.
If you want to play with the viz, feel free to do so. It has one subject filter, which shows you the stats of the chosen subject. You will probably find more interesting insights when you play with it.
Conclusion
I have answer these questions through a bit of exploratory analysis
- What is the age of the test takers? All ages. Most are between 18-20
- How well did the students do, score-wise? Median is 6.8. Test was tough
- What is the score distribution among age and subjects? The older you are, the lower score you got
- Are there any student that took more than five subjects? There was one students who took 9 subjects. Most took 6
- Is Nguyen the most common last name? :D It still is
If you have anything to suggest, please email me. I would love to hear from you!