28 Apr 2023
Given a dataset of a hypothetical pizza chains operating in Nevada and California, I built a heatmap showing the frequency of pizza sizes depending on which pizza you choose. This project used Observable and Plot library.

24 Dec 2020
In Vietnam, education is taken very seriously. Parents and students prepare three years of high school for one exam, that in many people's opinions determine your future. Before 2015, students has to take two exams: one deciding whether they graduate high school, and the other is the college entrance exam. These two exams now became one, therefore it is extremely stressful for students in their last year of high school.
In this project, I scraped 74,000 exam takers scores in 2020 from the official Government website of Ho Chi Minh City, analyzed it then visualized in with Tableau to give the audience insights on this exam.

24 Dec 2020
Since I started reading in 2018, I’ve been keeping track of the books I read, rating and reviews on Goodreads, and after two years, I had this small set of data available. I came across it the other day, when Goodreads showed me some stats on their website. Moreover, I recently started learning data science on my own, therefore I am so thrilled to analyze this data. My purpose of this analysis is to answer some simple exploratory and descriptive analysis questions with the help of R Studio: 1. How much books I’ve read over the years ? Do I read more every year? 2. I read books in Vietnamese and English? How many of those are Viet and how many are English? 3. Are there correlation between time of year and the amount of reading ? 4. Do I give better rating than other people do ? 5. How fast do I read ?

21 Dec 2020
What is your chance of surviving Titanic? Titanic is the name of a British passenger liner which sank in 1912. It was a tragic historical event, and there was a movie we all probably saw with Leonardo Di Caprio starring. It also inspired a Machine Learning competition held on Kaggle. It asked its participants to predict survivor rate of Titanic passengers based on information of their age, who they are traveling with, their ticket class, their fare fee, where they embark, their name. The dataset splitted into two, train set and test set, where train set has information of the passenger and their survival status (1 if Survived, 0 if Not Survived), while test set doesn't have the status. Participants train ML and predict the test set outcome, then submit their predictions for results. My second attempt used Decision Trees, and the accuracy went up to
78%.

15 Dec 2020
What is your chance of surviving Titanic? Titanic is the name of a British passenger liner which sank in 1912. It was a tragic historical event, and there was a movie we all probably saw with Leonardo Di Caprio starring. It also inspired a Machine Learning competition held on Kaggle. It asked its participants to predict survivor rate of Titanic passengers based on information of their age, who they are traveling with, their ticket class, their fare fee, where they embark, their name. The dataset splitted into two, train set and test set, where train set has information of the passenger and their survival status (1 if Survived, 0 if Not Survived), while test set doesn't have the status. Participants train ML and predict the test set outcome, then submit their predictions for results. For my first attempt, I used Logistic Regression with some few variables, and my accuracy was
76%.

01 Sep 2020
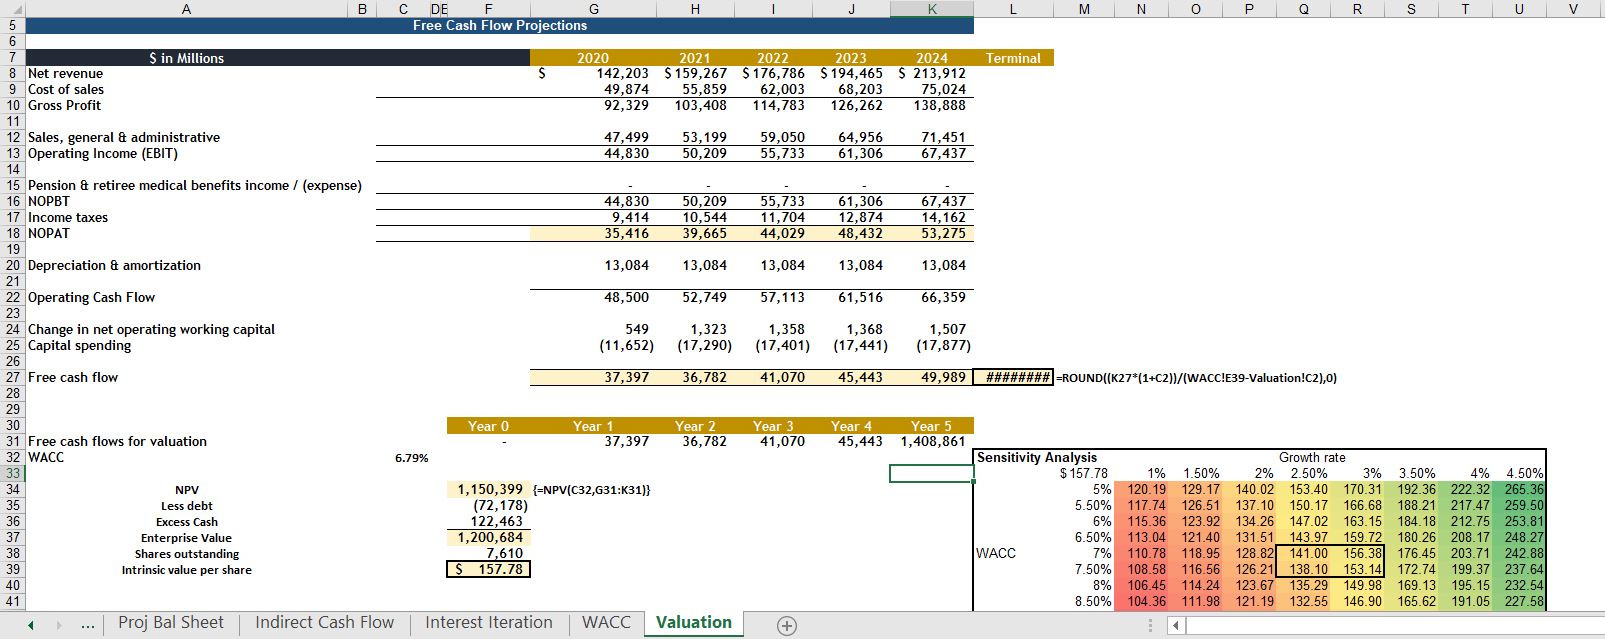
Some samples of my financial analysis work. I used to work as an investment analyst for an asset management firm back in Vietnam. I was in team managing a small fund of $3M USD. My responsiblities were to find opportunities in public stocks of the Plastics industry, analyze those stocks to find their appropriate value, figure out whether this is a good investment and pitch my recommendation to the portfolio managers.
01 Aug 2020
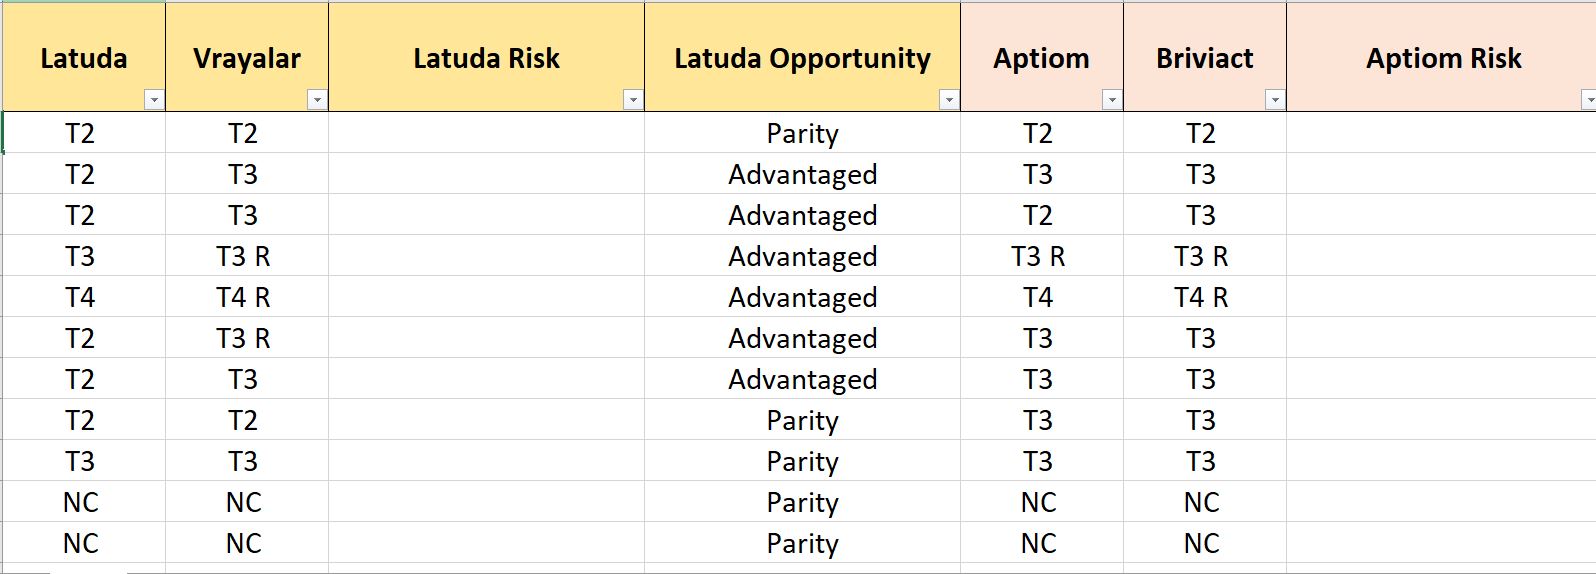
This script allows user to compare two drug formulary tier, to see whether the brand my company owns underperform or overperform competitor's brand. I created an array of the tier (tierlist), better to worse from left to right. While going through each row, my macro will find compare two brands by finding their position in the array, then compare them. Whichever brand got a lower number for position, has advantage over the other. The macro will the input either Advantaged, Disadvantaged, or Parity accordingly.
01 Jun 2020
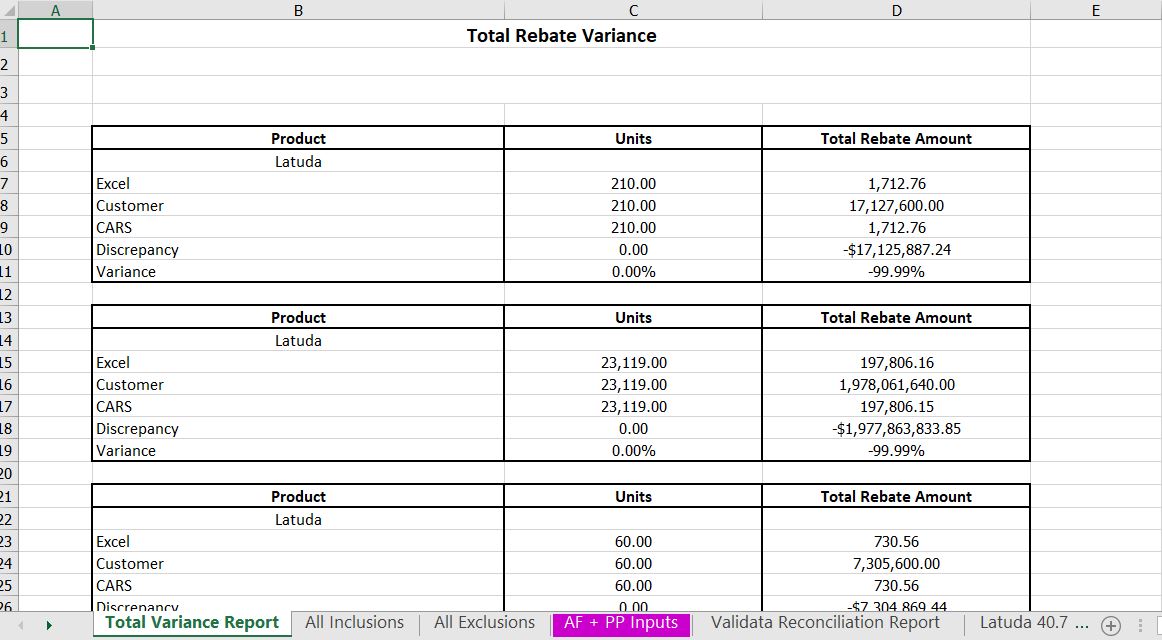
There is a common process in drug manufacturing, where after they sold their products to customers, they reimburse them. Customers will usually send in an invoice, claiming they should get a reimbursement based on the percentage written in the contract. Manufacturers will analyze these claims, and then issue a report to state whether the claim is valid, and then issue a reimbursement. This is called Variance Reporting.This reporting process often takes 2 - 3 days from the day they receive the claims, depends on the client size and the quantities of brands they bought. I have built a VBA script to automate this reporting process, reducing it to 30 minutes on average. One of my biggest Excel VBA scripts written to date.
01 Jun 2020
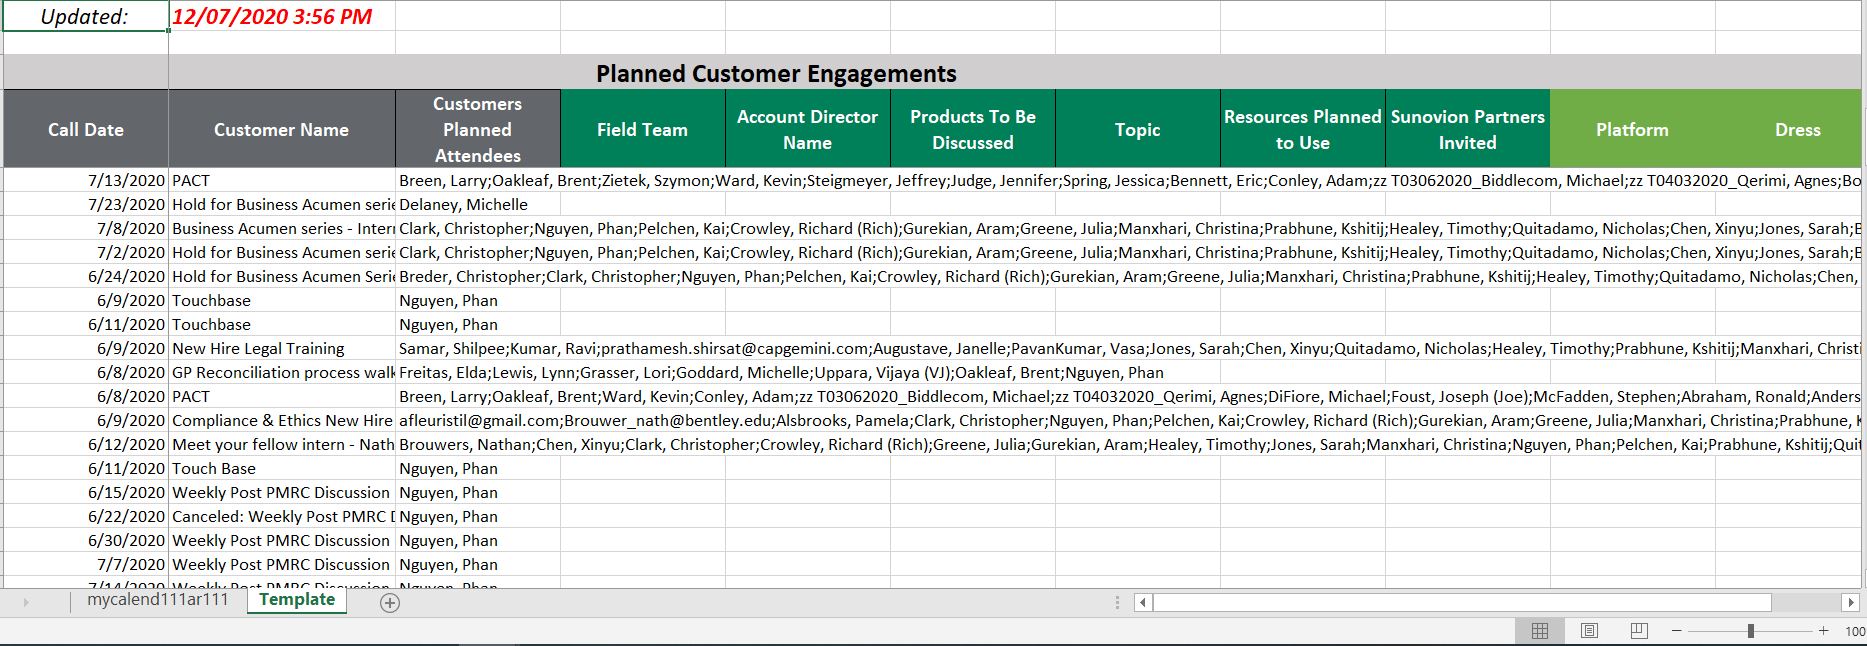
The sales department usually keep a document to record meetings with clients, which they update on a weekly basis. They used Outlook, WebEx to set up the meetings, then update it manually into this document. The manual update will take around a half hour every week. I have built a VBA script to automate this process. It allows users to extract the calendar from Outlook, under a .csv file, then extract the data from this .csv file into a template. This script reduces the process to only five minutes. You can watch the video to understand how it works.
24 Dec 2019
France Boissons is a study case company, having the same name as the beverage distributing company in France. As a group of six, we built a operational relational database for France Boissons and wrote the most common queries for them. Our team use Oracle SQL to generate tables and queries. Our database consists of 11 tables. Each table contains a primary key. Some tables contains one or more foreign key. Primary key is the field to seperate between instances in one table, and foreign key of a table is the primary key of another one. All the tables are formulated with the purpose of simulate a real life operational database with highly simple structure. We have common tables like Customers, Orders, Inventory, and more complex one like Inventory and Shipping, with many foreign keys. We used Oracle SQL to generate the tables and populate data.
28 Nov 2019
This classification machine learner is built for an academic project. I worked in a group of three, where I was the programmer. The purpose of this project is to use car specifications (horsepower, mpg, color, weight, etc.) to predict their MSRP (Manufacturer Suggested Retail Price) ranges, and also classify them as either a Luxury or Performance car. Our final outputs were two models, which detailed below. We use R Studio/ R Markdown to perform analysis and model building.
DatasetThis data set lists 10,879 cars, with detailed information about each. The data set was taken from Kaggle. The details include information such as make, model, year, engine, and transmission type of the cars, wheels, number of doors, vehicle size and style, MPG in city and highway, market category, popularity and price of the cars. All the recorded car information in the set is based in the US between 1990 and March 2017 inclusive.

28 Dec 2013
Hyde is a brazen two-column Jekyll theme that pairs a prominent sidebar with uncomplicated content. It's based on Poole, the Jekyll butler.
### Built on Poole
Poole is the Jekyll Butler, serving as an upstanding and effective foundation for Jekyll themes by @mdo. Poole, and every theme built on it (like Hyde here) includes the following:
* Complete Jekyll setup included (layouts, config, 404, RSS Feed, posts, and example page) * Mobile friendly design and development * Easily scalable text and component sizing with `rem` units in the CSS * Support for a wide gamut of HTML elements * Related posts (time-based, because Jekyll) below each post * Syntax highlighting, courtesy Pygments (the Python-based code snippet highlighter)
![]()
07 Feb 2012
Howdy! This is an example blog post that shows several types of HTML content supported in this theme.
![]()
06 Feb 2012
Jekyll is a static site generator, an open-source tool for creating simple yet powerful websites of all shapes and sizes. It is a simple, blog aware, static site generator. It takes a template directory and spits out a complete, static website suitable for serving with Apache or your favorite web server. This is also the engine behind GitHub Pages, which you can use to host your project’s page or blog right here from GitHub.
![]()


